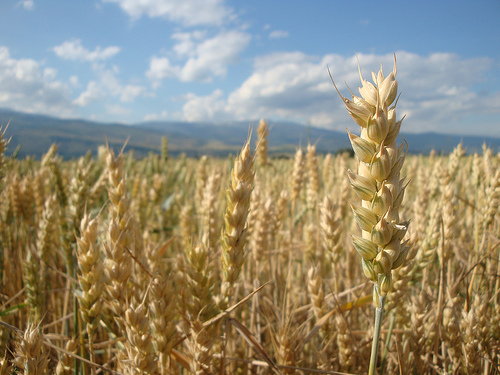
Corn, rice, barley, oats. Cereals are more and more present on our tables, increasingly used in our kitchen and really appreciated by our palates.
Cereals have become a strong point for the agricultural sector and production: a real wealth for the agricultural activities.
Grains are grown and disseminated: statistical data collected on time and accurately by Eurostat show us a great increase in the production of cereals in Europe.
The production of cereals (including rice, the most famous cereal) in the 28 EU countries was estimated to be 305.5 million tonnes in 2013. This was the highest production since 2008, the year when started the economic crisis. This new data show that in Europe there is about one eighth of global cereal production
Between the EU countries some of those have the leadership in this crop activity.
France, alone, is able to count for one quarter (22.0%) of the EU-28’s cereal production in 2013. Germany (15.6%) and Poland (9.3%) together contributed for another quarter of the European total; finally, Spain was the fourth largest cereal producer (accounting for 8.2% of the EU’s output).
The statistics show us a good situation concerning the productions of cereals but we have also to considerer the price of cereals in EU countries. This theme is very important for customers and the Eurostat research is very useful to understand the real price of cereals in European countries.
Concerning the deflated out price, cereals register an important increase. Indeed the greatest variations in EU-27 prices and the overall highest price increases between 2005 and 2012 were recorded for cereals and potatoes.
The most interesting case is the Southern of Europe because we have different data: Spain (–12.%) and Portugal (–7.8%) were the only EU Member States to report deflated output prices for crops lower in 2012 than it had been in 2005; there was no change in the price of cereals in Greece.
Italy is completely different: reported deflated output prices for crops increasing at a relatively slow pace (a total increase of 10%) as Belgium and the Netherlands.
By contrast, output prices for crops rose by 65.3% in Hungary and by 54.6% in the United Kingdom between 2005 and 2012, while the remaining EU Member States saw crop output prices rise within the range of 18–36%.
Prices, indeed, change from countries to countries; the Eurostat report, for example, show us the difference prices in EU for soft wheat. There aren’t huge differences between EU countries: it means that the European Union is trying to create a real common market where prices are quite the same.
In Denmark 100 kg of soft wheat cost 20.50 – In Greek 21.55 – In Portugal 20.45 – In UK 21.95 (remember that UK doesn’t have Euro so the price in pounds is different) – in Poland 19.00 – in Finland 20.42.
This research shows different data and allows different conclusion: the production of cereal is a strong activity for agriculture system and there isn’t a huge different but unfortunately there is a general increase of price during the last years.


